
Geographies of Tech Wealth: San Francisco to "Silicon Border"
As the companies, workers and wealth of Silicon Valley creep north into the city of San Francisco, the effects of an industry with a relatively small but highly paid labor force are leading to widespread social unrest. Embodied in the symbolic protests around “Google Buses,” lower-income residents are reacting to tech’s ability to produce so much wealth that is thinly distributed to a small labor force, disinvested from local infrastructure (with private transportation), and funneled to comically useless purposes like the “Google Barges” mysteriously floating in the Bay. However, conversations about tech wealth are often limited to its distribution—with even mainstream economists (as well as The Economist) conceding that, “Facebook will never need more than a few thousand employees.” Clearly, the other side of this is production; even with its relatively small labor force, Facebook can generate billions in wealth and profits. Instagram, the hip photo sharing mobile application, famously had only 13 employees when it sold for $1 billion (that’s around $77 million per employee).
As the companies, workers and wealth of Silicon Valley creep north into the city of San Francisco, the effects of an industry with a relatively small but highly paid labor force are leading to widespread social unrest. Embodied in the symbolic protests around “Google Buses,” lower-income residents are reacting to tech’s ability to produce so much wealth that is thinly distributed to a small labor force, disinvested from local infrastructure (with private transportation), and funneled to comically useless purposes like the “Google Barges” mysteriously floating in the Bay. However, conversations about tech wealth are often limited to its distribution—with even mainstream economists (as well as The Economist) conceding that, “Facebook will never need more than a few thousand employees.” Clearly, the other side of this is production; even with its relatively small labor force, Facebook can generate billions in wealth and profits. Instagram, the hip photo sharing mobile application, famously had only 13 employees when it sold for $1 billion (that’s around $77 million per employee).
What is going on is not only a lack of distribution but an industry’s ability to generate massive profits without the need of a sizable labor force.
San Francisco: Canary of “Wageless Life”
If Detroit is the metropolitan victim of “deindustrialization,” then San Francisco is the victor of the “high-tech economy.” But the centrality of San Francisco in new modes of profitability is experienced in highly unequal ways. While the clashes between long-time residents and the inflow of high-wage “techies” are amplified by the geographic constraints of the San Francisco peninsula, this isn’t just a story about inequality, nor about a lack of housing supply as some cheekily imply.
More than inequality, San Francisco’s unrest stems from a population facing an economy that no longer needs them. Those being evicted from communities of color are not only facing gentrification but also perpetually low-wage labor in an economy that doesn’t need them to produce competitive profits.
Economist and presidential advisor Larry Summers made headlines early this year when he shared his fears of “secular stagnation”--effectively insufficient demand to grow the economy. But as Michigan economic sociologist Greta Krippner has pointed out, this is not a new process, since the rise of “financialization” in the 1980s was already a response to the economic stagnation that began in the 1970s in the U.S. It is in the context of what appears to be the geographic limits on U.S. profits (because of limits of domestic demand, global competition, and over production) that tech provides an avenue for profitability relatively unencumbered by the physical constraints of labor and time.
Working hand in hand with financial speculation, tech is the new industry with the promise of fixing the West’s “New Growth Conundrum.” Chillingly, as the eviction of Bay Area workers foreshadows, a larger economic transition may push a significant part of the domestic labor toward what Yale historian Michael Denning has called “wageless life.” For Denning, these are workers who are a “relatively redundant population,” or to borrow a term from a different context, “populations with no productive function [in the tech economy].” Demand doesn't seem to be the root problem as Summers suggests, as expansions in credit access and the household debt burden have long buttressed wageless demand.
Some might note that high-wage jobs in San Francisco aren’t the only jobs generated by the tech economy. This is true, and following the money of the information economy eventually leads one abroad.
“Silicon Border” and Microwork: The Travels of Tech Wealth
To say that tech and the information economy do not distribute wealth is not to deny that it travels. Of course, venture investments and speculative growth are enabled by flows of global capital. However, equally dynamic is the outsourced production of microchips and the novel “Impact Sourcing” or socially targeted “microwork,” both of which skip the domestic U.S. labor force and seem to be jumping directly to the global South, pre-branded as a poverty solution too!
Tech wealth, in the form of wages, is distributed to somewhat familiar outsourced manufacturing sites. One peculiar example of tech wealth’s international travels is a 4,500-acre free enterprise zone in development not a mile south of the U.S.-Mexico border outside Mexicali. Dubbed “Silicon Border,” this commercial development is managed by the firm Jones Lang LaSalle, whose website prominently features their “2014 World’s Best Outsourcing Advisors” recognition.

Rendering of phase 1 of Silicon Border development, to include a “Science Park” as well as housing and a commercial units. Source: Silicon Border.
Marketing its first of four phases, investors seeks to attract tech industrial work for semiconductor manufacturing, boasting the site’s “Asian manufacturing cost structure in strategic North American location, [Mexican] Government incentives ranging from tax holidays […] free trade zone status […] with USA and 43 additional countries [and] access to reliable electric power, fresh water, waste water treatment and fire suppression systems [in the middle of the Yuma desert].”
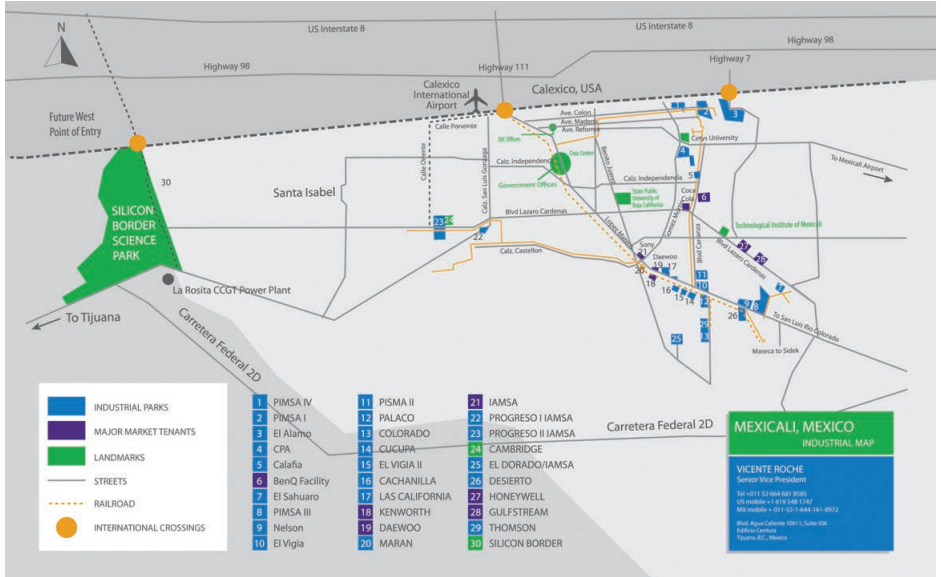
Map produced by Silicon Border developers shows the massive scale of the development when compared to Mexicali, with a population of 700,000. Also, blue boxes represent other, smaller, manufacturing parks all built along international railways and international ports of entry. Source: Silicon Border.
If Silicon Border represents an adaptation of well-known models of securing cheap manufacturing labor abroad, the novel emergence of “microwork” is outsourcing with a social conscious. Microwork initiatives operating globally seek to build a business model around recruiting un- or underemployed workers to perform simple data-based tasks online (think of it as a global information assembly line). While the microwork model is in its infancy, it has already attracted companies like LinkedIn, Google, and Microsoft to this “pay-as-you-go” labor model. Differentiated from outsourcing with the brand “socially targeted sourcing,” this model is promoted as a 21st century solution to poverty that provides not only employment but equips workers with information and communication skills. In the words of the Rockefeller Foundation, social targeted sourcing generates both “financial and social value.” A report commissioned by the Rockefeller Foundation last year estimated that the market for microwork sourcing could rise to $20 billion by 2015.

Diagram mapping the locations of Impact Sourcing Service Providers, most operating in the global South. Source: Rockefeller Foundation.
Perhaps rather than questioning the distribution of tech wealth, we should question the terms of its production and forms of its global movements. The travels of tech wealth are dynamic, but profoundly uneven and unequal. As UC Berkeley MCP student Christina Gossmann shows, there even exists an extensive economy of electronic waste in the rubbish dumps of Kenya—a nation that is working to connect to streams of tech wealth by marketing itself as a potential “Silicon Savannah.” (Also see the Silicon Cape initiative in South Africa).
The eviction of working class families from San Francisco, and rise in inequality, should not be approached as a starting point, but rather as a symptom of a dangerous shift in production to rely heavily on tech wealth. The effects of this are not only domestic, but also unequally global, as this short article has suggested.
To quote artist and journalist Susie Cagle’s brilliant animation of the “class wars” in San Francisco: let’s stop talking about buses, “let’s talk money.”
Luis Flores is a Judith Lee Stronach Fellow at UC Berkeley and runs the Collective History Archive, an interactive oral history platform on debt, the recession, and the “New Economy.” He is a research intern at Causa Justa :: Just Cause. Luis can be reached at jr.luisf@gmail.com

Vestiges of San Francisco’s Unbuilt Waterfront
San Francisco has oftenserved as a blank canvas since its rapid rise to prominence after the Gold Rush in the mid-1800s – the subject of countless visions for how the built environment should be designed. Whilesomewereoutlandish and others more grounded, the many ideas advanced over the years for guiding the City’s development have each presented a roadmap for moving forward, complete with nested values of what is most important for the future. Such is the subject ofUnbuilt San Francisco – an exhibit currently presented at five locations around the Bay Area, including at UC Berkeley (more details below). On display are plans, renderings, models, and other media depicting unrealized visions for the San Francisco Bay Area. Some of these proposals, such as a BART line running into Marin County, many wish had been built; others, like Marincello, a 30,000-person community in the now-preserved Marin Headlands, we cannot imagine advancing today. The exhibit covers a journey of great breadth, ultimately leaving the viewer with anuneasy sense of what could have been.
San Francisco has oftenserved as a blank canvas since its rapid rise to prominence after the Gold Rush in the mid-1800s – the subject of countless visions for how the built environment should be designed. Whilesomewereoutlandish and others more grounded, the many ideas advanced over the years for guiding the City’s development have each presented a roadmap for moving forward, complete with nested values of what is most important for the future. Such is the subject ofUnbuilt San Francisco – an exhibit currently presented at five locations around the Bay Area, including at UC Berkeley (more details below). On display are plans, renderings, models, and other media depicting unrealized visions for the San Francisco Bay Area. Some of these proposals, such as a BART line running into Marin County, many wish had been built; others, like Marincello, a 30,000-person community in the now-preserved Marin Headlands, we cannot imagine advancing today. The exhibit covers a journey of great breadth, ultimately leaving the viewer with anuneasy sense of what could have been.

In the 1960s, a large planned development was proposed to be built in the Marin Headlands by the Gulf Oil Corporation. In the face of strong opposition from various environmental groups, in 1972, the company reluctantly sold the land so it could be incorporated into a new national park – the Golden Gate National Recreation Area. Source: Thomas Frouge, developer
The lasting impact of the Unbuilt San Francisco exhibition, though, is not simply an understanding of the Bay Area’s various unrealized futures, but more fundamentally an appreciation of how the choices made in the past impact how we see things today.
San Francisco’s ever-evolving waterfront is an excellent case study. Indeed, the edge of the Bay might have turned out quite differently than what we see today. A turn-of-the-century plan imagined the Ferry Building at the foot of Market Street surrounded by towering Roman-style columns. Decades later, another would have replaced San Francisco’s beloved waterfront monument with a modernist-inspired World Trade Center, surrounding a large sun dial. These ideas may sound outlandish today, but they were seriously considered at the time.
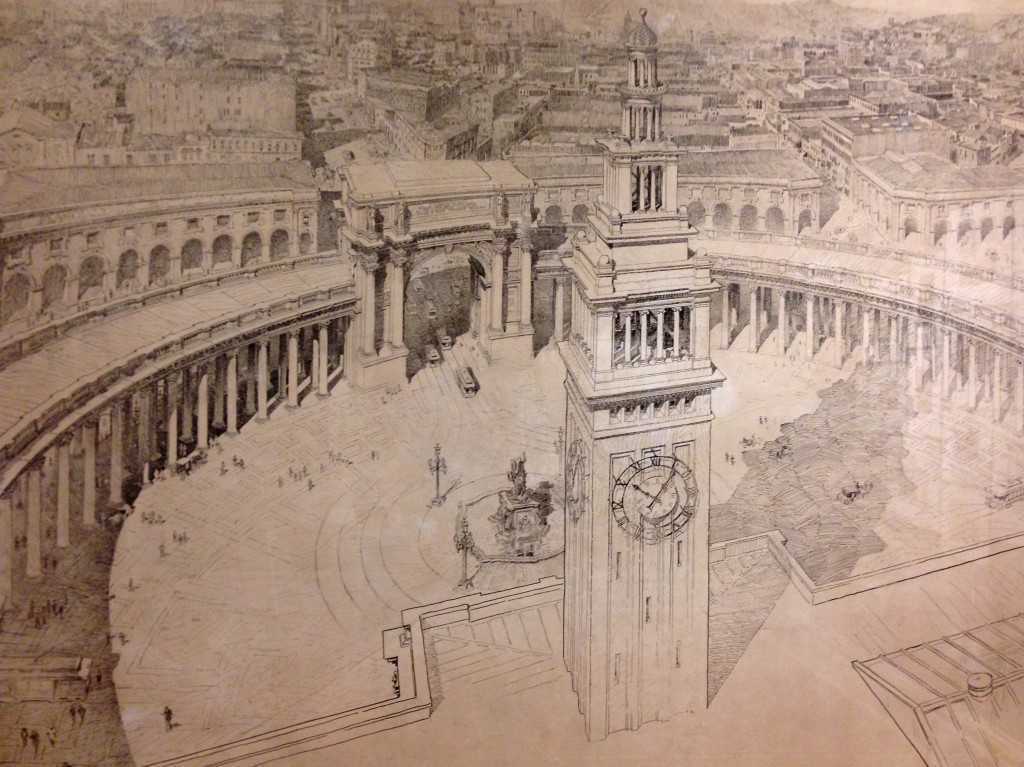
This turn-of-the-century vision would have created a grand public space in front of the Ferry Building encircled by classically-styled columns and arches. Source: Willis Polk (1897)

Another vision would have done away with the Ferry Building altogether and replaced it with a modern World Trade Center. The slender center tower and sun dial seem to allude to the structures they would have replaced. Source: Joseph H. Clark (1951).
One idea in particular has had an enduring influence on how we envision the waterfront today: the proposal for an elevated high-speed motorway running the length of the Bay’s shoreline.
In the 1950s, following the national trend, an ambitious network of limited-access freeways was conceived for San Francisco, crisscrossing all corners of the 7-by-7-mile city. Despite being swept up by the freedoms of automobility, freeways were far from welcomed in San Francisco. As the first few structures went up, including the double-decker Embarcadero rising between Market Street and the Ferry Building, people began to realize the damaging effects the roads were having. In swift response, the now famous Freeway Revolt was born.

Citizens crowd into City Hall wearing signs on their heads to express their opposition to the freeways being erected all over San Francisco. Source: San Francisco History Center, San Francisco Public Library.
Freeways in San Francisco were opposed for various reasons, but much of the discourse centered on aesthetics and access. Beyond being unsightly, neighborhoods that received the early motorways were walled off from their surroundings and quickly succumbed to blight and loss of vitality. After years of fierce opposition, the citizens' revolt was ultimately successful in blocking most proposed freeways, and the Embarcadero was only partly completed (it was originally proposed to connect with the Golden Gate Bridge). Just 21 years after the Embarcadero’s completion, it took only seconds for the 1989 Loma Prieta earthquake to damage the structure enough to warrant taking it down. Though many enjoyed the access it provided and called for reconstruction, then-Mayor Art Agnos envisioned a new aesthetically-pleasing waterfront, and fought for the freeway to be replaced with the grand boulevard we know today. Few look back longingly.

Citizens crowd into City Hall wearing signs on their heads to express their opposition to the freeways being erected all over San Francisco. Source: San Francisco History Center, San Francisco Public Library.
The unrealized vision for a complete freeway network in San Francisco has left citizens sensitized not only to future roadway proposals, but also to any project that might possibly impact the waterfront’s aesthetics, access, or views. One need look no further than the controversial 8 Washington project rejected by voters earlier this month – what would have been a 134-unit luxury condominium development along the waterfront, adjacent to where the Embarcadero Freeway used to stand – to see this. The project had diverse opposition – from those who questioned building $5 million condos in a city struggling to provide affordable housing,to those who criticized its parking ratios – but most discourse concerned appearance and accessibility. Critics focused on the project's 13-story height, roughly twice that of the late freeway, claiming it would have blocked views and access to the Bay, thereby tarnishing the waterfront’s appeal.

This rendering, drawn up by supporters of 8 Washington, takes an elevated perspective, showing the tall buildings of the Financial District in the background, to downplay the project’s heights.
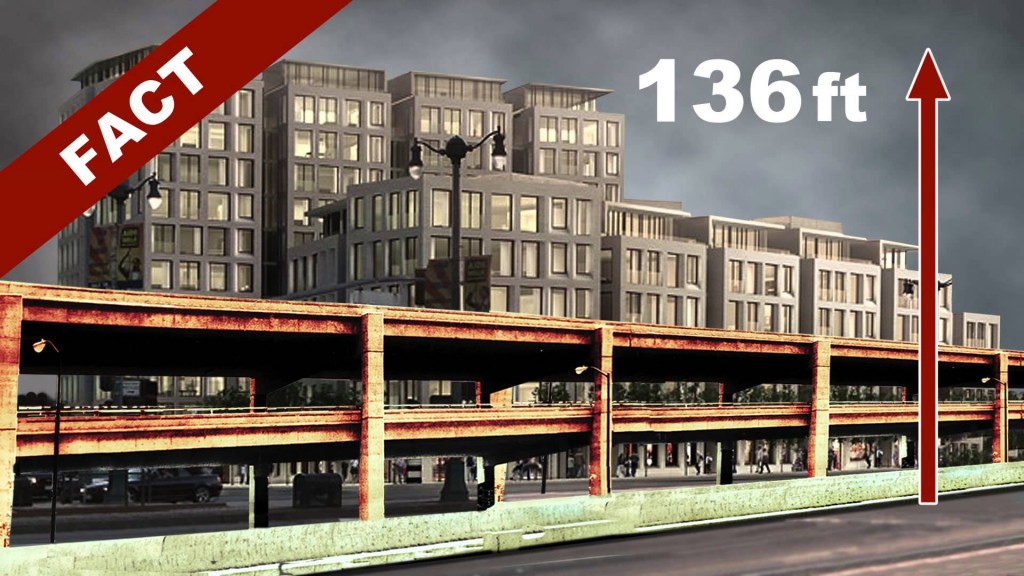
The opposition's image instead takes a ground-level perspective, juxtaposing the Embarcadero Freeway in front of 8 Washington, to illustrate the development’s towering design.
In typical San Francisco fashion, the 8 Washington debate became so heated that it was the subject of not one but two propositions on the November ballot earlier this month. Voters were asked if they approved of the decision to allow the project to exceed existing height limits. The ‘No on B & C’ campaign strategically employed the slogan “No Wall on the Waterfront” and made direct comparisons to the Embarcadero Freeway (campaign ad embedded below). Former Mayor Art Agnos reemerged as a spokesperson for the opposition, proclaiming that “8 Washington will be the first brick in a new wall along the waterfront.” Despite the obvious differences between the fallen freeway and 8 Washington, people were concerned that the progress made along the waterfront in recent years would be lost if the proposal moved forward. Ultimately, both initiatives were soundly voted down almost two-to-one. The developer may choose to return with a new down-sized proposal, but at least this version of 8 Washington joins the list of San Francisco’s unrealized visions.
http://www.youtube.com/watch?v=cujWdElxCHk#action=share
Ideas remain unrealized for many reasons – because they do not match prevailing values, they were not well-conceived, or perhaps they just were not well-articulated – but some nevertheless persist, influencing decision-making to this day. The many unbuilt visions for San Francisco’s waterfront have not only influenced what was actually built, but have left a more enduring impact on how people imagine its possible futures. Turning over the waterfront to the purely utilitarian role of moving automobiles was ultimately rejected, replaced by a more aesthetically-focused public space. The discourse surrounding this unbuilt vision continues, sensitizing people to anything that might once again “wall off” the Bay’s shoreline. Planners and designers would be smart to inform themselves of the waterfront’s complex evolution, lest they propose something that has no chance of actually being built.
Unbuilt San Francisco is a collaborative effort of AIA San Francisco, Center for Architecture + Design, Environmental Design Archives at UC Berkeley, California Historical Society, San Francisco Public Library, and SPUR. The exhibition will be on display at various locations throughout the Bay Area through the end of November 2013. More information about specific dates and locations of showings can be found on the organizational websites linked above.
Mark Dreger is working towards his Masters in City and Regional Planning at UC Berkeley, concentrating in transportation and urban design. He is a San Francisco native and interested in the nexus between systems of mobility and the public realm. He can be reached at m.dreger@berkeley.edu.
Eyes on the Street: CED Alum’s Film Finds an Audience
While a graduate student at the College of Environmental Design, Darryl Jones completed the short film This Is Market Street as a companion piece to his thesis in landscape architecture. The film, shot in 2012, spurs a dialogue about the future of Market Street, San Francisco’s most central street, and preserves an experience of the corridor before its transformation. This Is Market Street is screening for free at the San Francisco Public Library at 6:00pm on Wednesday, June 26, and at SPUR at 12:30pm on July 11. A panel discussion and Q+A will follow. Presented by Walk San Francisco and the Better Market Street project. For more information, go to http://www.walksf.org.
Why did you make this film? Why Market Street? Why a film?
I have been a hobby filmmaker since I was kid, but the landscape has always been my inspiration. I saw this as an opportunity to merge two of my interests: landscape architecture and filmmaking. For the past few years I have been thinking about how to do it, and it dawned on me that graduate school would be a good place to start. In fact, during a conference at UC Berkeley in the early 2000s, a group of landscape architects deliberated on the idea of how film could be utilized to bring the landscape, and landscape architecture, into the cultural mainstream. Reading about their discussions inspired me to answer their call.
I chose Market Street in San Francisco because currently, there is a huge effort to study and eventually redesign the street. It intrigued me because it is a monumental design project, not the kind you see very often, and I knew it would be happening for several years, so hopefully, the film would have some traction. Also, it is my hope that my film will be an educational artifact, long after the street has changed.
How was making the film? How much time did you spend filming? How much time did you spend on Market Street?
The key to good film production is good pre-production, which I didn´t really do, I’m a little shy to admit. Like I said before, I grew up making films, but I learned how amateur I was as a result of this project. This realization has actually led me to pursue more of these projects. The historical footage is all from a website called www.archive.org, and if you haven´t used it, it is a great resource, even if you´re just curious about history! Some of the footage is from the Prelinger Archives, a Library of Congress collection, which is curated by Rick Prelinger, a Bay Area archivist and writer. He has compiled some amazing collections of archival footage of San Francisco and the Bay Area, including A Trip Down Market Street, which is the infamous film taken from the top of a streetcar on Market Street only days before the 1906 earthquake.
All in all, I spent 14 days shooting and usually was on Market Street an average of two-three hours each day. I complied 55 interviews, almost all of which are in the film. As is typical of documentary filmmaking, I discovered, it really comes together in the editing room. I spent probably triple the time editing than I did actually shooting on Market Street.
Why do you think will Market Street be redesigned and how will it be?
It’s still a little early in the process, and the Better Market Street team isn’t quite in the unique design phase yet. They have presented three options and are at the stage of getting feedback on those options. Part of the purpose of these screenings on June 26 and July 11 is to raise awareness about the upcoming public workshops, where everyone can go to be a part of the decision-making.
Personally, I think San Francisco is ready for a more pedestrian Market Street. That is the key to it becoming more livable, because it’s just a ghost town in some places, and unsafe in others. Since Market Street is so integral to all the other modes of transit and the flow of adjacent streets and spaces, it is going to take some bold experimentation and inspiring proposals to actualize this project.
How do you feel about Market Street?
That’s a tough question. I think Market Street inspires me. It feels like the center of the city, and I believe that is a really important feeling for a city to have. Feeling like you’re at the heart of it all is one of the best feelings about cities; when you say to yourself "I’m really here right now—this is where the energy is". It’s no mistake that tourists come to Market Street. Obviously, they come for the cable cars a lot of the time, but I think they really come to experience the heart of the city. There is something monumental about its size and orientation that cannot be denied, and when you revisit history, you start to really root for Market Street.
Is the redesigning process on Market Street similar to what is happening in other cities?
I’m not sure I can answer that accurately, but from my experience I have definitely seen these projects in other cities. My hometown of Raleigh, North Carolina, redesigned their two main streets in recent years, to much success. However, cities are always making plans to revitalize their streets, so it’s nothing new. But the scale of what is being proposed for Market Street may be very ambitious compared to other cities.
Do you think your film will make a difference?
I certainly hope so! If anything, I just hope it will encourage people to be excited about how design affects their lives, and that they can be a part of the conversation.
Is it home? [Watch the film to understand the significance of this question!].
Haha, good question. For me, truthfully, it isn’t. I live in Oakland, so that may be why. But I certainly feel a connection with Market Street, and the more time goes by, the more it becomes familiar to me and the more I admire it.
Darryl Jones is a recent graduate of the University of California, Berkeley, where he received his Masters of Landscape Architecture. He is an active artist, designer and filmmaker whose work focuses on the relationship between people and their environment, specifically as a human being on foot. He currently works at a small architecture practice in San Francisco, CA. Darryl can be reached at DarrylJones@cal.berkeley.edu.
Who takes BART out to the Ball Game?
October 9, 2012

What BART riders pay for each trip is based on distance, and the fares are all calculated electronically, so the agency has a massive record of trip behavior by origin, destination, time and date. BART also notes happenings that affected ridership, such as major concerts, festivals, and sporting events. If you need to know the "bump" in ridership the night Lady Gaga sold out the Oracle Arena, BART can tell you.
And if you're a curious student and ask nicely, sometimes they'll share.
Browsing some of these data for a class congestion management study, I kept coming back to the sporting events. AT&T Park (home of the SF Giants) is well served by transit, and the Athletics' Oakland Coliseum is literally across the street from a BART station. It seems reasonable that baseball fans, even visitors from out of town, would take BART to a baseball game. But what visiting team inspires the biggest bump in BART ridership?
BART's "bumps" are the uptick in ridership at the stations nearest the baseball stadiums that can't be explained by regular ridership trends. I divided each bump by the stadium attendance for that day's game. So if 10,000 people showed up at a ballgame, but only 3,000 extra people rode BART (0.3), that would be less impressive than a game with 5,000 attendees where 2,500 extra people rode BART (0.5).
I calculated this ratio for every Giants and A's home game of the 2010 and 2011 regular season. I averaged the ratios across visiting teams to get a transit ridership rate by team.
Certainly correlation is not causation, many other factors affect ridership, this is only two year’s worth of data, and there’s no consideration of weather, time of day, or day of week. But both teams are in the playoff, and for bragging purposes, it's worth knowing if one's favorite team does better than their opponent.
A's fans are far more likely to take BART to a Giants game than Giants fans are to an A's game. This is strange, until you consider that the A's stadium is swaddled in parking. Maybe the Giants fans take it as an opportunity to tailgate?
What’s up with these Yankees fans? If anyone should be accustomed to taking transit, you’d think it would be those who root for the Bronx Bombers. Anecdotally, a fair number of Bay Area residents lived in New York at some point. They may cheer for the visiting team, but be local enough to live in the Bay Area and own a car. The other New York team, the Mets, correlate with higher transit ridership as expected.
But both the Giants and the A’s are hosting playoff games today, so the important question is: Does transit ridership correlate with a win for the home team? If you average the ridership rate of winning games versus losing games, it's about even in Oakland. But in San Francisco, the Giants actually do a bit better with higher BART ridership. In a sport so famously obsessed with luck, maybe riding transit will become the next great superstition.
Photo of Stomper courtesy of the Oakland Athletics.